Key takeaways
- The CME FedWatch tool prices a 65.7% probability the Fed holds rates at 3.50-3.75% on July 29; the selloff is driven by bond market mechanics, not just the immediate rate decision.
- Megacap tech companies are projected to spend over $470 billion on AI capital expenditures in 2026, a balance sheet burden highly vulnerable to surging long-term Treasury yields.
- With the 10-year Treasury yield hitting 4.71% and the 30-year surging, rising long-term borrowing costs act as a direct discount rate against the high valuations of stocks like Alphabet ($4.31T market cap) and Apple ($4.25T).
- JPMorgan CEO Jamie Dimon explicitly warned against buying long-term Treasuries on July 21, citing massive fiscal deficits and anticipating a structural "crack" in the bond market.
- The FOMC's short-term rate decision will not control the 10-year yield; a bear steepener means Powell's stance is secondary to Treasury auction dynamics and sticky inflation data.
On Monday, July 27, 2026, the stock market buckled. The S&P 500 slid, the Nasdaq Composite took a heavier hit, and the financial media scrambled for a clean narrative. The easiest culprit? The Federal Reserve. The Federal Open Market Committee (FOMC) convenes its two-day meeting on Tuesday, culminating in a rate decision on Wednesday, July 29. But if you are selling your equities because you think Jerome Powell is about to derail the economy, you are looking at the wrong end of the telescope.
The reality, baked into the pricing on CME's FedWatch tool, is far less dramatic—and far more dangerous. As of July 26, the market assigns a 65.7% probability that the Fed will simply hold the federal funds rate at its current 3.50% to 3.75% target range. There is a distinct, pricing-in-hawkish-surprise chance of a quarter-point hike, but the base case is a pause. The Fed is not the trigger for Monday's flight from equities. The trigger is the bond market, which is currently screaming a warning about the sustainability of megacap tech earnings at exactly the moment those companies are forced to report them.

The Bond Market's Structural Squeeze
Wall Street loves to ignore the bond market until it forces an audit. Right now, the audit is brutal. The yield curve—the spread between short-term and long-term Treasury yields—is sending deeply conflicting signals that underwrite the current volatility. While the widely tracked 10-year minus 2-year spread (T10Y2Y) currently sits in positive territory around 35 basis points, the underlying mechanics of the long end of the curve are flashing amber.
Long-dated Treasury yields have surged to multi-year highs. On July 23, the 10-year Treasury yield touched 4.71%, and the 30-year sits heavily in the market's throat. When long-term yields rise independently of Fed policy—a phenomenon driven by persistent fiscal deficits and sticky inflation expectations—it creates a punishing discount rate for future cash flows. This is the exact structural shift that CNBC flagged on July 27 as a major warning signal for stock valuations.
It isn't just a technicality. JPMorgan Chase CEO Jamie Dimon crystallized this institutional anxiety on July 21. In a series of blunt remarks, Dimon explicitly warned against buying long-term Treasuries at current yields. He pointed to massive government deficits and unchecked fiscal spending. Even if inflation settles at the Fed's 2% target, Dimon argued that the sheer supply of bonds required to fund the U.S. deficit demands a higher risk premium. He expects a "crack" in the bond market, and when the smartest money in the room is bracing for an impact, retail investors should stop expecting the Fed to deploy a magical safety net.
The Megacap Earnings Wrecking Ball
While the Fed meeting commands the headlines, the actual detonation risk this week is the earnings docket. The week of July 27 is a showdown for megacap tech. Microsoft (MSFT), Apple (AAPL), Amazon (AMZN), Meta Platforms (META), and Alphabet (GOOGL) are all reporting. These are not just stocks; they are the structural supports of the entire S&P 500 index.
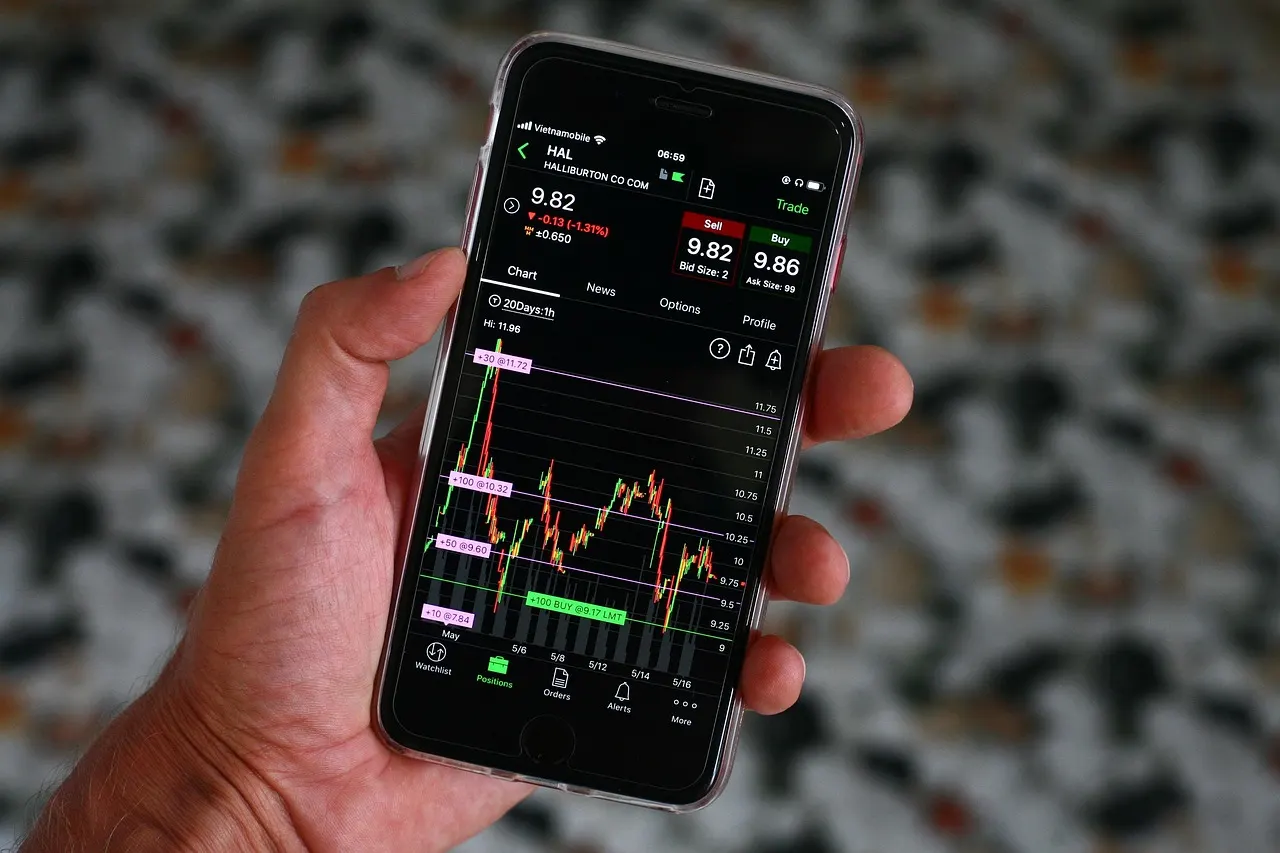
The vulnerability is in the math. The Magnificent Seven tech giants now command unprecedented market capitalizations—Alphabet trades around a $4.31 trillion valuation, with Apple trailing closely at $4.25 trillion. Their collective weight means the broader market is entirely hostage to their performance. Yet, rising long-term bond yields compress the valuation multiples on exactly these types of growth stocks. If the "risk-free" rate of a 10-year Treasury offers a 4.7% yield, the implied premium for owning a tech stock trading at 30 times forward earnings shrinks violently.
Furthermore, the AI capital expenditure arms race is bleeding these balance sheets. According to a January 2026 CNBC analysis, Microsoft, Meta, Alphabet, and Amazon were expected to boost combined capital expenditures to over $470 billion in 2026, up from approximately $350 billion the previous year. That kind of aggressive spending requires a macroeconomic environment with predictable, low-cost capital. The bond market is actively denying them that environment. When these tech behemoths step up to the microphone this week, they aren't just reporting quarterly profits; they are justifying half a trillion dollars in infrastructure spending against the headwind of surging long-term borrowing costs.
Why the Fed's Decision Is Beside the Point
Let's dispense with the fantasy that a Fed hold at 3.50-3.75% saves the stock market. It doesn't. The federal funds rate is a short-term overnight benchmark. It directly dictates what banks charge each other, but it does not control the 10-year Treasury yield, which is the actual discount rate that determines the present value of future corporate earnings. This is the phenomenon economists call a bear steepener—the long end of the curve rises independent of central bank policy. Powell could strike a perfectly dovish tone on Wednesday, promise a hold through the rest of the summer, and the 10-year yield could still rip higher on Thursday if a Treasury auction goes poorly or if a Friday jobs report proves inflation is sticky.
Investors who have spent the last decade front-running the "Fed Put"—the assumption that the central bank will immediately slash rates to rescue falling asset prices—are discovering the Put is either broken or expired. With the federal funds rate already cut down from 5.50% peaks to a still-restrictive 3.50-3.75% over the preceding 18 months, the central bank has precious little dry powder left, and the inflation data gives them no cover to use it. A 65.7% probability of a hold is not a safety guarantee. It is an admission that the primary lever of macroeconomic stimulus is jammed.
The Economic Backdrop: Reading the Curve's Tea Leaves
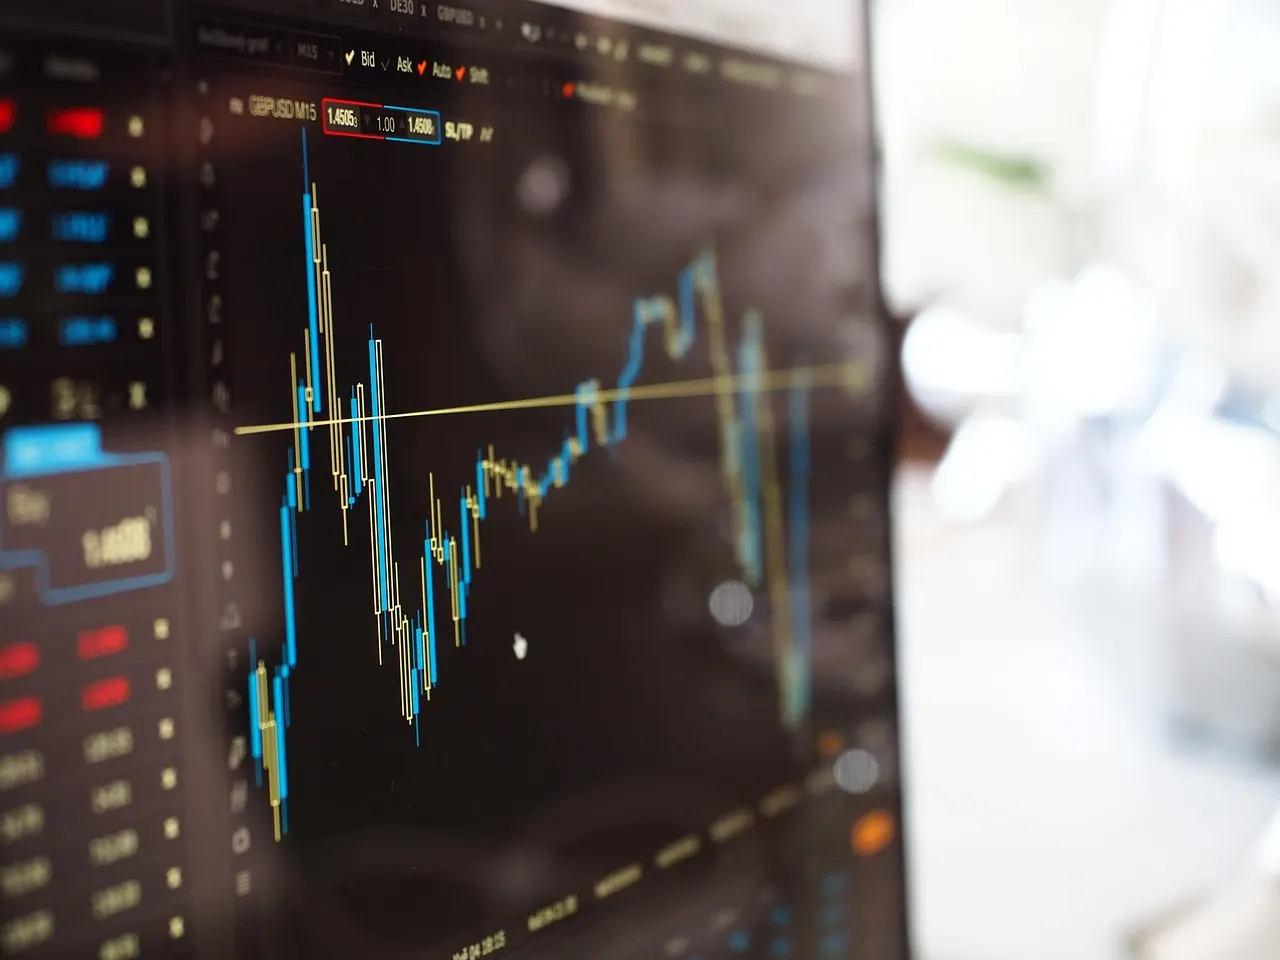
Recessions are not scheduled; they are priced in retrospect. The bond market is currently trying to figure out the timing. According to an analysis highlighted by the Federal Reserve Bank of Cleveland's predictive models, which track the yield curve's implications for GDP growth, an inverted curve historically indicates a recession roughly a year out. While the immediate, momentary un-inversion we are tracking (as the 2-year yield at 4.37% sits below the 10-year at 4.71%) could simply be a return to normalcy, the violent sector rotations and market leadership shifts suggest the economy is walking a tightrope.
The macro data reinforces this tightrope walk. The yield on the 10-year Treasury dipped slightly to 4.65% on July 27, a fractional 0.04 percentage point decrease from the previous session, indicating a brief flight to safety amidst Monday's equity selloff. Yet, the underlying momentum of long-term rates remains historically elevated. Investors are no longer just demanding yield; they are demanding a term premium to hold U.S. government debt for a decade. When the safest asset in the world requires a higher risk premium, risk assets—specifically high-multiple tech stocks—get repriced downward. The stock market selloff on July 27 was not random volatility; it was a direct repricing of risk based on Treasury market fundamentals.
What the Reader Does Next
The convergence of the FOMC meeting and megacap earnings on July 29 is not the time to gamble on a binary outcome. It is a time for strategic exposure management. If you hold heavy concentration in the Magnificent Seven, understand that you are making a highly leveraged bet on the continuation of AI capital expenditure returns, explicitly wagering against the warning signals the bond market is currently broadcasting.
First, scrutinize the earnings calls this week for capital expenditure guidance. If tech leadership signals any hesitation in spending the projected $470 billion, the market will not wait for the Fed to react; it will reprice the stocks immediately. Second, stop treating long-duration government bonds as a guaranteed safe haven. If Jamie Dimon is vocal about avoiding them, retail portfolios should not be blindly accumulating them. Third, broaden your horizon. The Dow Jones Industrial Average and industrial sectors have shown resilience, occasionally hitting record highs while the tech-heavy Nasdaq lags. A market correcting internal excesses often leaves value and dividend-paying sectors standing. Position for the end of the Fed-put era, not its resurrection.
The article shows the pattern. The app trains the response.
Continue in Tikva to turn the insight into a repeated response.
Open TikvaSources and review notes
Tikva separates educational content from medical, legal, investment, and personalized financial advice. Sensitive pages should be reviewed by qualified professionals before high-scale publication.
- CNBC — Market outlook for July 27-31, 2026, detailing the collision of megacap earnings and the Fed meeting.
- CNBC — Jamie Dimon's July 21 warning on long-term Treasuries, fiscal deficits, and market risk.
- CME FedWatch Tool Data — 65.7% probability of a rate hold at the upcoming July 29, 2026 FOMC meeting.
- FRED Economic Data — 10-Year Treasury Constant Maturity Minus 2-Year Treasury (T10Y2Y) yield curve spread.
- CNBC — Big Tech's projected AI spending pushing combined capital expenditures to over $470 billion in 2026.
- Federal Reserve Bank of Cleveland — Yield curve and predicted GDP growth recession probability models.
FAQ
What does an inverted yield curve actually signal?
Historically, an inverted yield curve—when short-term interest rates exceed long-term rates—signals an impending economic slowdown or recession. According to Federal Reserve Bank of Cleveland models, this inversion typically indicates a recession approximately one year in advance.
Why won't the Fed's decision to hold rates save tech stocks?
The Fed's federal funds rate is a short-term overnight benchmark. It does not directly control the 10-year Treasury yield, which functions as the discount rate for long-duration corporate cash flows. If long-term yields remain high due to deficits and inflation fears, high-multiple tech valuations suffer regardless of a Fed hold.
How much are megacap tech companies spending on AI?
Microsoft, Meta, Alphabet, and Amazon were projected to boost combined capital expenditures to over $470 billion in 2026, a massive increase from the approximate $350 billion spent the previous year. This spending requires cheap capital, making the companies highly sensitive to long-term bond yield spikes.
What is a bear steepener in the bond market?
A bear steepener occurs when long-term interest rates rise at a faster rate than short-term interest rates, independent of central bank policy. It usually signals investor fears of long-term inflation and growing fiscal deficits, demanding a higher term premium to hold government debt.